 Skip to content
As with most important goals, engagement is not easy to achieve because it requires high doses of patience, a customer-centric approach, great service, and empathy with the user. The key is to gain the trust of the client gradually, but also have an understanding of where you stand on the engagement level. Believe it or not, we have found that many of our clients don’t know how to tell whether their website is engaging, and unfortunately assume the best when there is work that needs to be done. In this article, we will show you the different ways you can really test to see if your website is engaging for users.
Website Engagement Indicators Backed by Data
There are several indicators that can help you quantify the degree of interaction of users with your company website or brand:
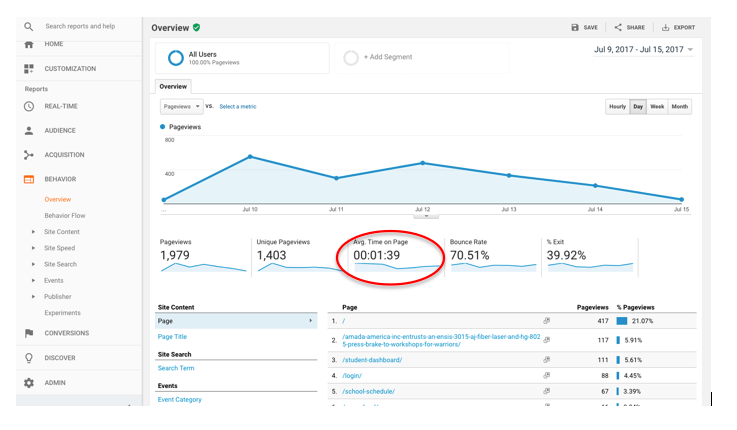
- The average duration of each session. It represents the average time users spend on your website. We want the duration to be as long as possible sine this means that the web and its content are of interest to your user, and will also help with SEO positioning of your pages. You can find this number by going to Google Analytics and then Behavior > Overview.
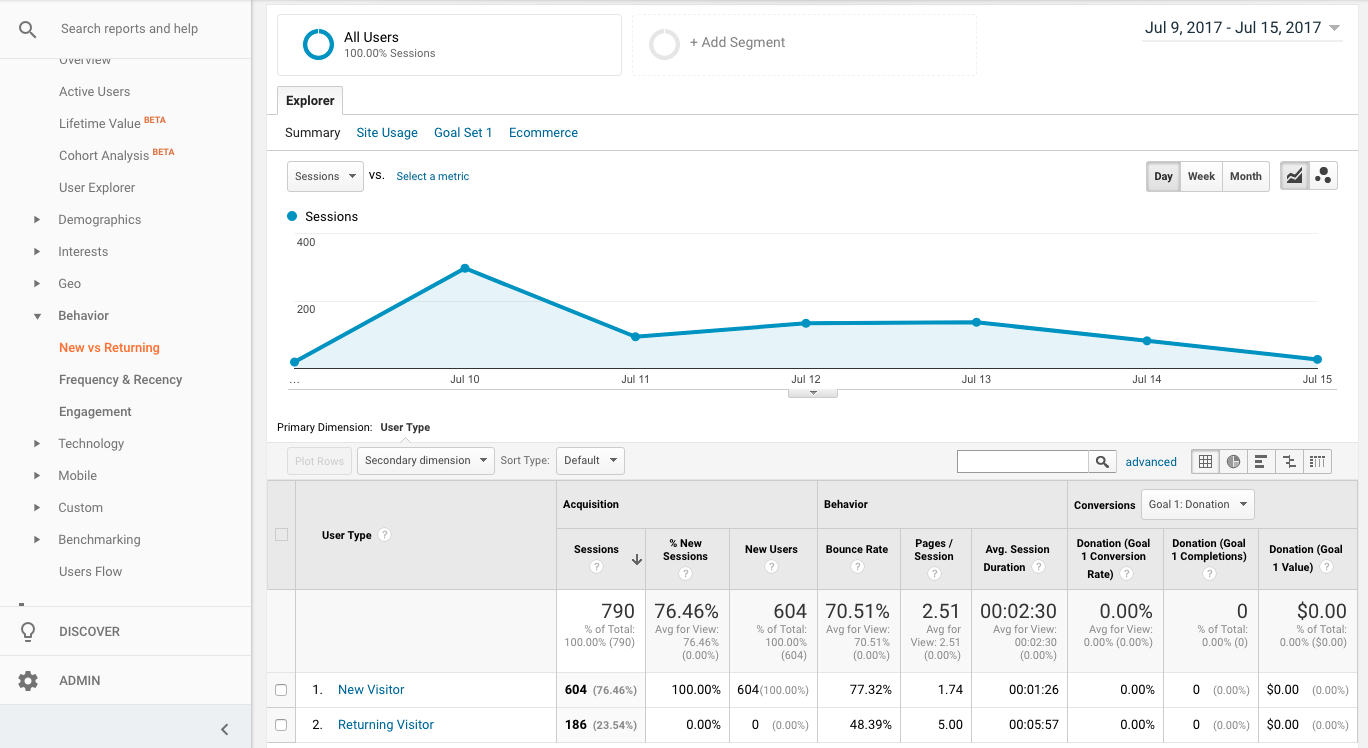
- Returning visitor. This metric tells you the percentage of users who enter more than once on your web page. It is measured thanks to the cookies that are registered. A high percentage is, without a doubt, good news, because it means that the users feel at ease with you. Find this by going to Google Analytics and then Audience > Behavior >New vs Returning.
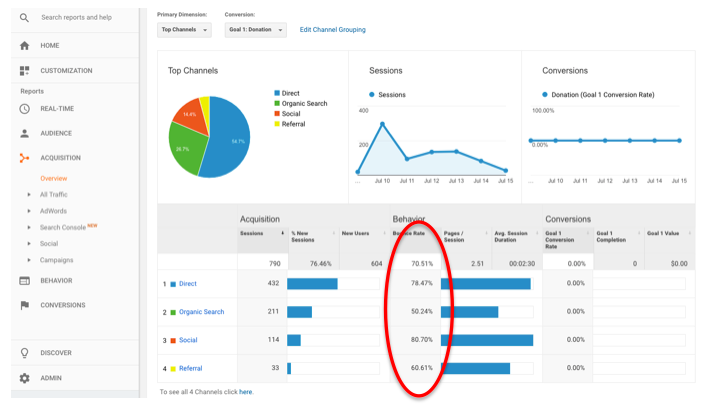
- Bounce Rate. If the user enters your website, sees only one page and then leaves the site, this would affect your bounce rate. You should not be alarmed if this percentage is very high since this measure must always be studied together with the dwell time (the time that elapses since the user clicks on your result in Google, reads your content, and leaves). Find this by going to Google Analytics and then Acquisition > Overview.
Engagement Rate and Social Media Measurements
Engagement is the degree to which a consumer interacts with our Brand, the loyalty, and commitment to it. Measuring this may seem impossible or at least rather difficult, but this is where the Engagement Rate comes in, or the interactions of followers with brands in different social networks. They can be Likes, comments, shared posts, recommendations, retweets, favorites, answers, etc.
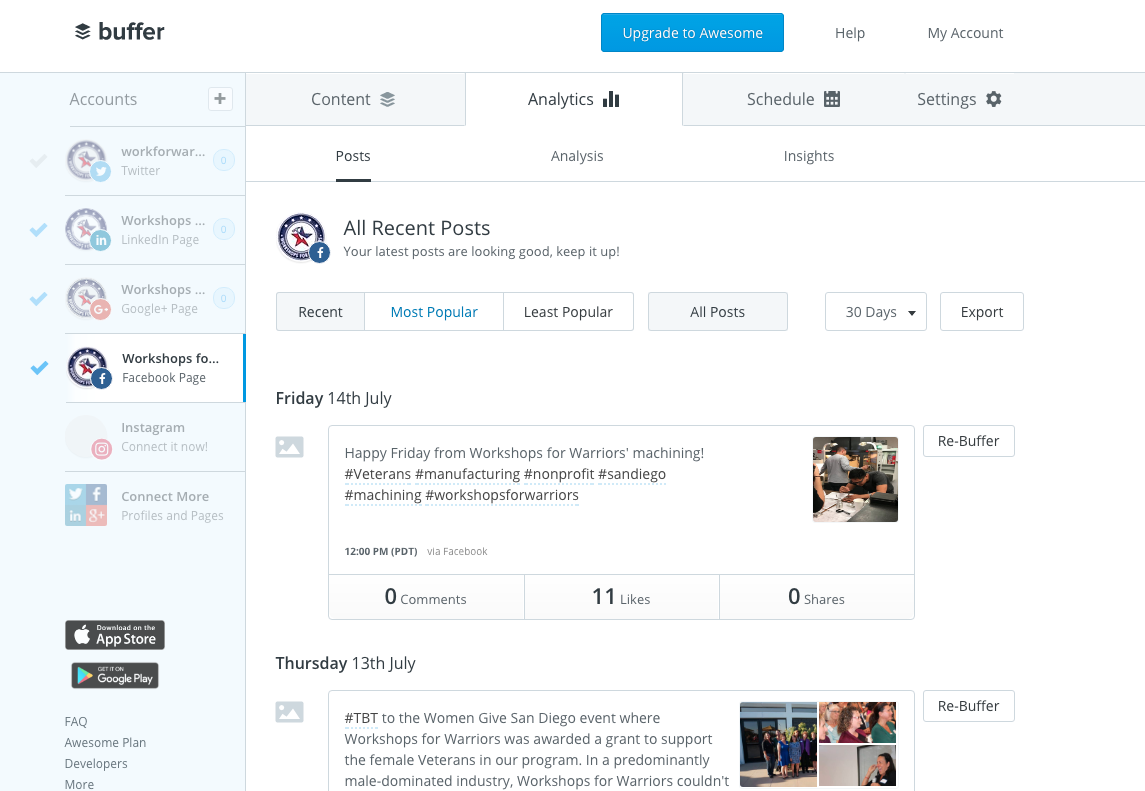
Another variable that takes into account this rate are impressions on Twitter and reach on Facebook. The first consists of the number of times a tweet was viewed, while the second covers the number of users who saw your posts. You can find this by looking at the Analytics tools built into the social networks, or using a tool like Buffer and navigating to the Analytics tab, as seen in the example below:
The Engagement Rate is a very useful ratio, a percentage that serves:
- To evaluate the reception of your content and find the best copies, formats, hours, days, etc.
- To compare yourself with competitors (even with the standards in your sector or even, if you are a multinational, with other countries).
- To know if the growth of your community is qualitative
The larger the fan base of a page, the more difficult it is to get your audience involved, which means that administrators of larger pages need to create better quality content for fans to interact with.
A crucial factor in finding the right Engagement Rate for your Page is its size and the frequency with which you write. A small page, for example, a local restaurant, will have it easier to reach its followers than a global brand with millions of fans.
Formulas to Measure the Engagement Rate:
-
Interactions / Scope or Impressions x 100
Through this calculation, we will know what interactions we achieve in proportion to the people who have seen our publications.
Advantages: ngagement Rate is a realistic scenario, because there will be people who see our tweets without being actual followers.
Disadvantage: We can only know the scope or impressions of the publications of the accounts and profiles that we manage. This means that this formula does not serve for competition analysis, for initial audits of potential clients, or for sector studies.
-
Interactions / Fans or Followers x 100
With this formula, we will know how much engagement we generate based on the size of our community.
Advantages: We can calculate it even if we are not administrators of the social profile since both the interactions and the number of followers are public. That is why this is the way to calculate the engagement rate when you want to compare yourself to the competition.
Disadvantages: We are looking to measure what percentage of the people who see our publications are motivated to take action—share, comment on them, etc. If we use the number of fans to calculate, in reality, what we are getting is the conversion to an interaction of our fans, both those who have seen us and those who have not.
-
Weighted Interactions / Scope or Impressions x 100
The last formula to measure Engagement Rate has one key aspect: not all interactions have the same value. It is not the same to mark a tweet as a favorite than to take the time to comment on a publication or give a retweet.
Advantage: It is a more accurate formula since it takes into account the different value of each interaction and gives them a weight according to its importance.
Disadvantage: This can be a longer, more labor intensive formula to calculate.
The Takeaway
In the end, while it may seem like a lot of work, understanding whether or not your website (or webpages more specifically) is engaging is crucial. Visit here to understand the basics of Google Analytics data and get started as soon as you can!
What metrics and/or formulas do you use to measure engagement? Let us know your thoughts and your experiences in the comment section below.