To succeed in today’s tech-driven world, every marketer and agency needs solid data analysis skills. But there’s more to data analysis than just setting up an analytics tool and waiting for results to roll in. Understanding data is a specialized skill that takes practice and the right mindset. These eight tips will help you start extracting more meaningful information from your data.
-
Learn the Ins and Outs of Google Analytics.
There are tons of web analytics tools out there to choose from, but Google Analytics is still the most popular – more than half of all websites use it. There’s a good reason for that: Google Analytics is powerful and versatile, but still simple enough that beginners can learn to navigate it. It’s also free. All in all, if you’re new to analytics, using GA is the best way to get your feet wet with data analysis. There are plenty of resources online that will show you how to get up and running with this tool, including official tutorials from Google. Once you get comfortable with it, you might find that GA is the only analytics tool you need.
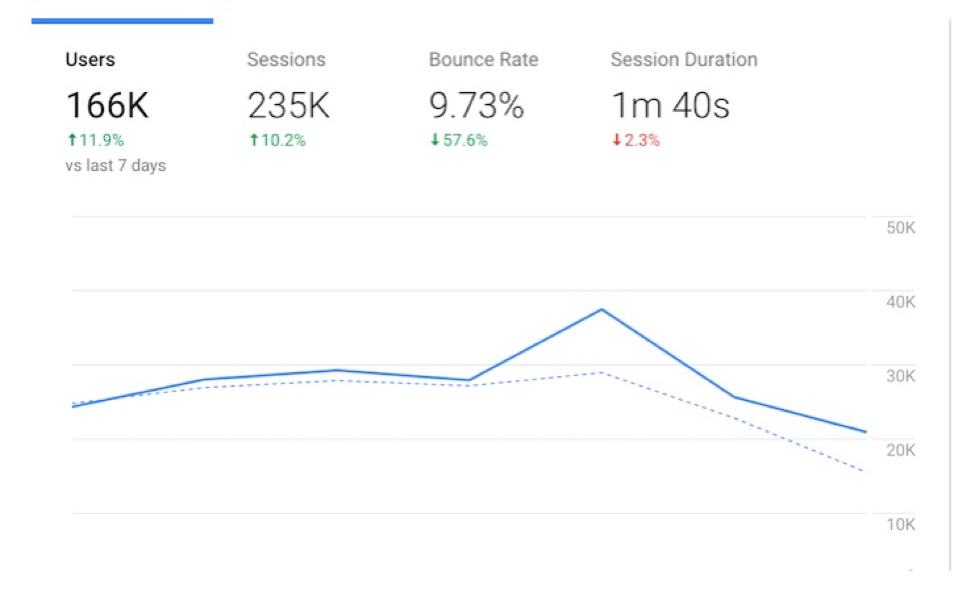
Google Analytics is simple enough for beginners to use, but powerful and customizable enough for advanced users, too. Source
-
Ask Questions Before You Start Picking Your Data Apart.
Data is only useful in context. If you start looking at your data without any clear purpose in mind, you probably won’t come away with any useful insights. To actually use your data, ask it questions. For instance, maybe you want to know:
- How much organic traffic does your blog bring you every month, and how many of those visitors end up making a purchase?
- How many leads drop off your radar in the middle of your sales funnel, and why?
- How quickly is your social media strategy growing your audience?
- Why aren’t people opening your marketing emails?
When you approach your data with questions like this in mind, you’ll have a better idea which metrics you should be watching. You’ll also be able to define and track your goals more easily.
-
Choose Analytics Tools Based On Your Needs.
Many businesses use more than one analytics tool to gather and organize data. If you decide to go this route, it’s important to understand exactly what you’re looking for before you commit to a platform. What do you want this tool to do for you, and why? For instance, maybe you want to see heat maps of where people click on your site, or maybe you want an event tracking feature that doesn’t require you to do a lot of complex hand-coding. Whatever you do, make sure your expectations for your tools are realistic. No matter how many bells and whistles a platform has, it can’t interpret your data for you – that’s a job for a human.
-
See the Big Picture.
It’s easy to miss the forest for the trees when you’re looking at data. Sure, it’s important to keep an eye on your recent and real-time numbers – but don’t forget to zoom out sometimes, too. Looking at a larger selection of data over a longer time period can help you distinguish overall trends from day-to-day fluctuations. Marketing and SEO campaigns often take time to work, so zooming out can be the best way to get an accurate picture of your progress. It can also help you identify recurring patterns like seasonal trends.
-
Don’t Forget About Social Media Analytics.
Website analytics are many businesses’ main concern. But if you use social media, keeping an eye on your analytics there will give you a well-rounded picture of your overall strategy’s effectiveness. Facebook, Twitter, Pinterest, and Instagram all have built-in analytics tools you can use.
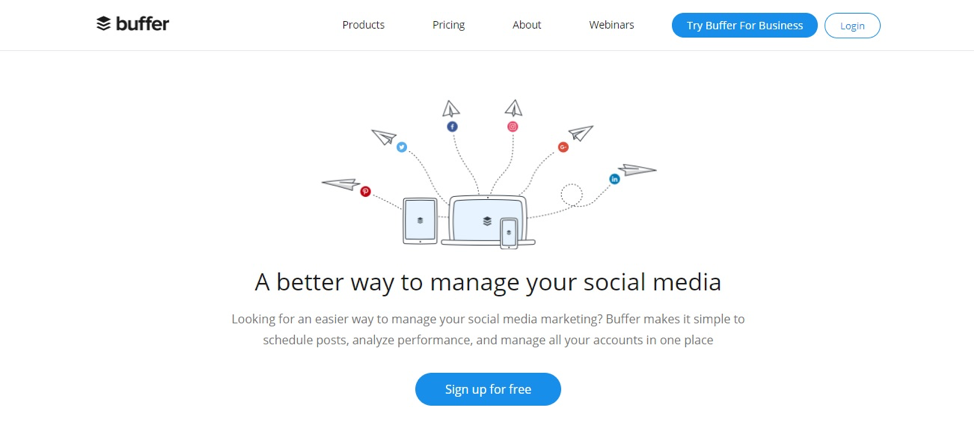
If you’d rather have all your social stats on one dashboard, you can also look into paid third-party tools like Buffer:
-
Collect Feedback from Real Users.
If you’re having trouble interpreting your data, getting feedback from real people can be invaluable. Sign up for a service like UserTesting to get a window into real users’ experiences, thoughts, and issues with your site. This kind of feedback could lead to the “aha” moment you need to figure out what your data is saying.
-
Collect All Your Data in One Place.
Seeing all your most important metrics next to each other can help you understand the connections between them. Consider using a tool like Chartio, Whatagraph, or Megalytic to get a bird’s-eye view of your whole strategy at once.
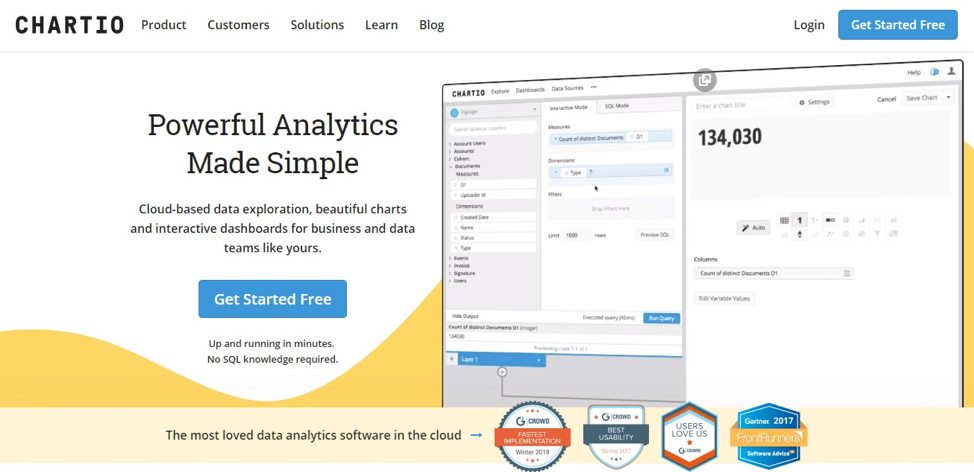
Chartio: This tool helps you visualize your data, create a variety of dashboards, make predictions based on your data, and more. The platform is SQL-based. While knowing the language isn’t a requirement to use Chartio, you’ll be able to unlock the full power of this tool if you know at least a little SQL.
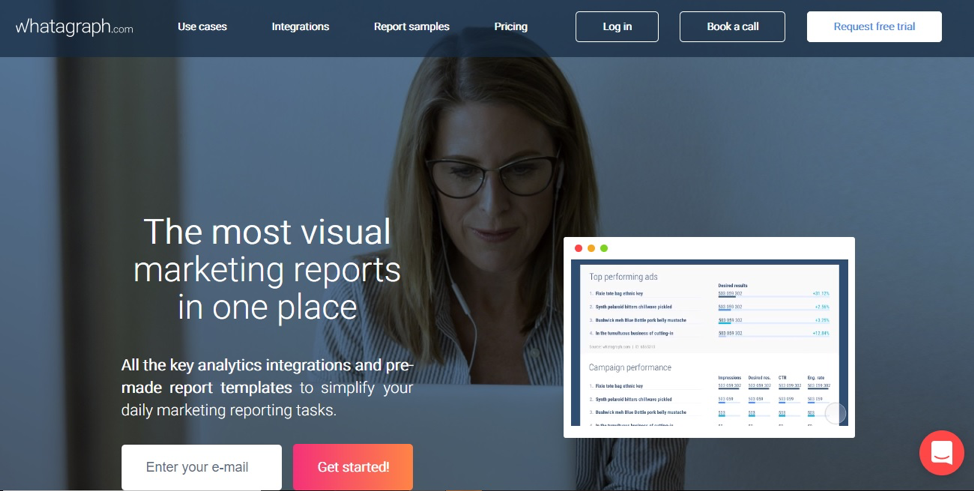
Whatagraph: This tool generates visually-powerful reports for you with minimum effort. All you have to do is connect your data sources (Whatagraph supports all the major analytics platforms) and specify what you want on the report. This tool is useful for people who want great visuals in one place without any hassle or coding.
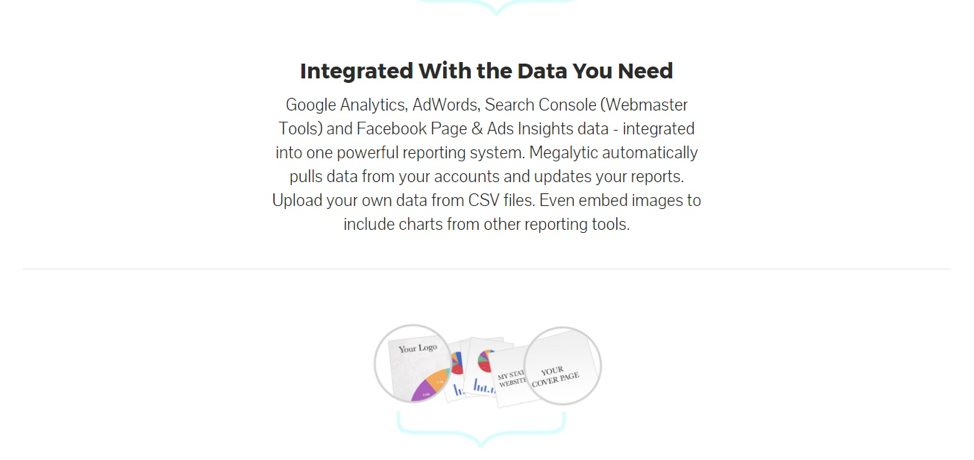
Megalytic: Megalytic is another report-building tool. It’s compatible with Google’s various analytics tools (Google Analytics, Google Webmaster Tools, and Google Adwords), as well as Facebook’s analytics. You also have the option to upload your own data from other sources.
-
Talk It Through.
The best way to understand something is often to explain it to somebody else. Bouncing your thoughts off another person can also help you find flaws in your reasoning and different ways of thinking about things. Sit down with a coworker and discuss your metrics – or just practice by yourself by pretending you’re explaining your analytics in-depth to someone sitting beside you.
Wrapping Up
Successfully analyzing your data isn’t just a matter of finding the right analytics platform. In fact, the approach you take to data analysis is more important than which platforms you choose. By adopting a mindset that focuses on asking questions and seeing the big picture, you’ll be able to probe more deeply into your data and glean more actionable insights from it.


